Visualize Your Ideas: 10 Types of Infographics Diagrams to Elevate Your Presentations
Infographics are an effective way to communicate complex information in a visually appealing and easily understandable format. In presentations, infographics can help convey important data and key insights in a clear and concise way. Here are 10 different types of infographics diagrams that are commonly used in presentations and their importance.
- Flowcharts: Flowcharts are diagrams that show the steps in a process. They are useful for breaking down complex processes into simple steps, and identifying potential bottlenecks or areas for improvement.

- Process Flow Diagrams: Process flow diagrams are similar to flowcharts, but focus specifically on the sequence of events in a particular process. They are useful for identifying inefficiencies or areas for improvement in a process.

- Swimlane Diagrams: Swimlane diagrams are a type of flowchart that show the roles and responsibilities of different departments or individuals in a process. They are useful for identifying areas of overlap or miscommunication between different departments.

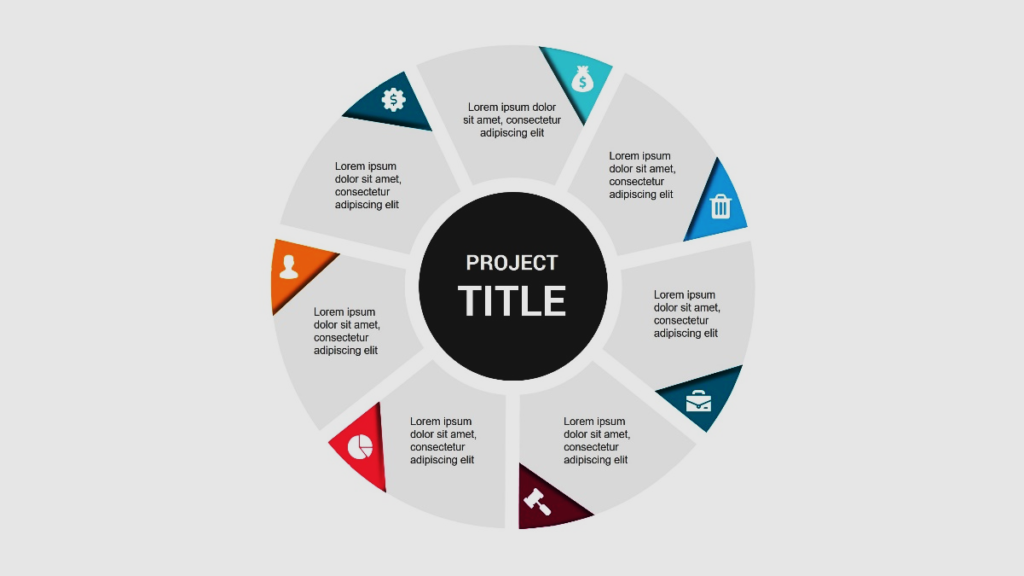
- Cycle Diagrams: Cycle diagrams are diagrams that show a repeating sequence of events. They are useful for showing the progression of a process over time, and identifying potential areas for improvement.

- Timeline Diagrams: Timeline diagrams are diagrams that show events or milestones over time. They are useful for showing the progression of a project or process, and identifying potential areas for improvement.

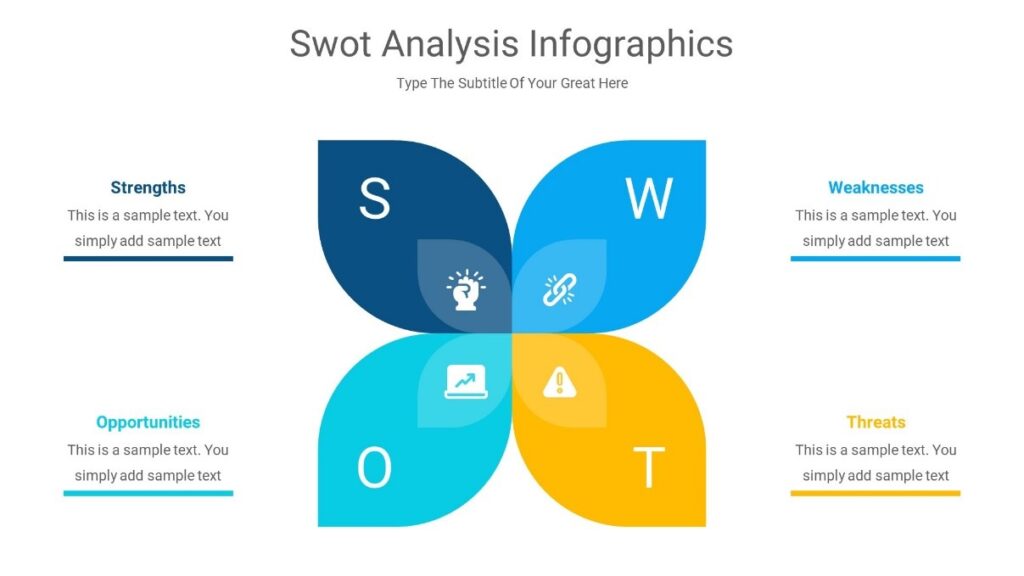
- SWOT Analysis Diagrams: SWOT analysis diagrams are diagrams that show the strengths, weaknesses, opportunities, and threats of a particular business or project. They are useful for identifying areas of improvement or potential risks.

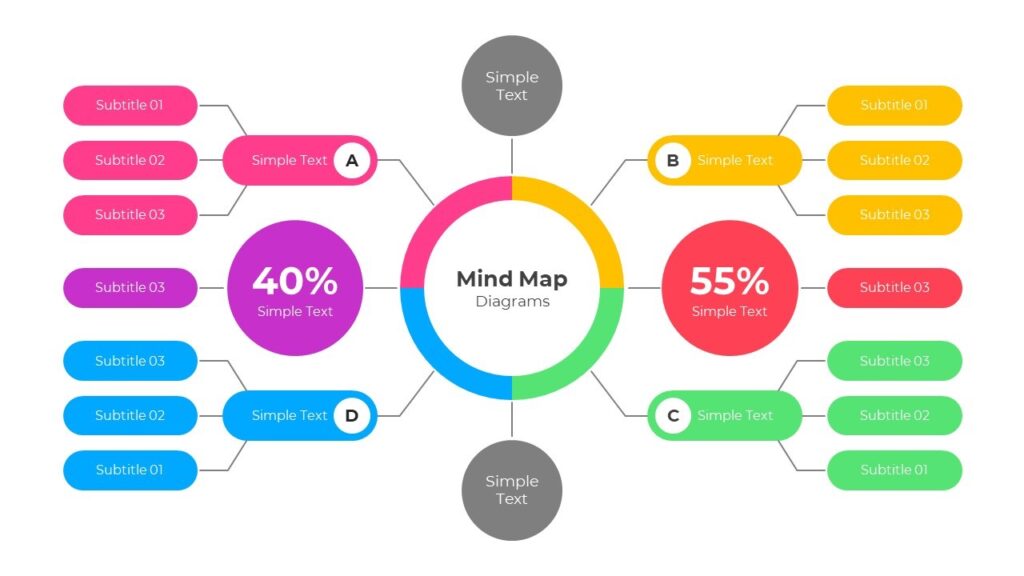
- Mind Maps: Mind maps are diagrams that show the relationships between different ideas or concepts. They are useful for brainstorming or organizing complex ideas.

- Fishbone Diagrams: Fishbone diagrams, also known as Ishikawa diagrams, are diagrams that show the potential causes of a particular problem. They are useful for identifying the root cause of a problem and developing solutions.

- Organizational Charts: Organizational charts are diagrams that show the hierarchy and structure of an organization. They are useful for understanding the roles and responsibilities of different individuals or departments within an organization.

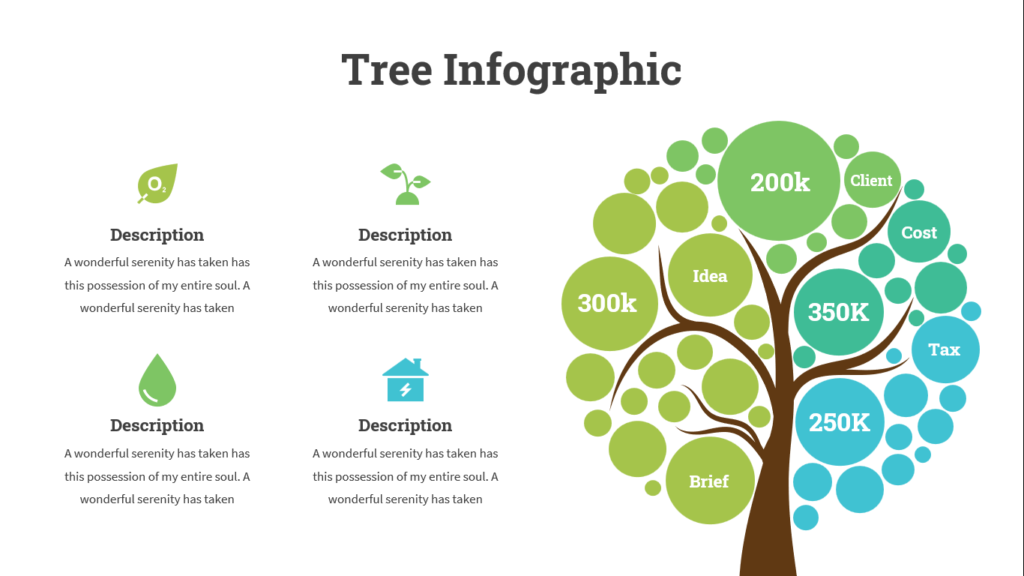
- Decision Trees: Decision trees are diagrams that show the different outcomes of a particular decision or set of decisions. They are useful for identifying the potential risks and benefits of different decision options.

In conclusion, diagrams are a valuable tool for presenting complex information and ideas in a clear and concise way. By using different types of diagrams in presentations, you can effectively communicate key insights and data to your audience, and identify potential areas for improvement or risk. So, next time you are preparing a presentation, consider using one or more of these different types of diagrams to convey your message effectively.
